In the process of evaluating the effectiveness of sales compensation on a regular basis, sales organizations want to know how the design of their plans and practices compare to the market. These questions include:
- What is the state of current plans, are they effective? What type of changes are companies considering?
- Are sales roles eligible for equity based awards?
- What are the most common measures used in sales incentive plans?
- All companies use commissions not bonuses, right?
- What are the commission percentages based on? When do they change?
- What is the mix of base salary and incentive? How does it vary by type of sales role?
Wilson Group covered these and many other questions in the 2014-2015 Survey of Sales Compensation Practices. An updated survey report will be available in the fall 2017.
Results of the 2014-2015 Survey
Twenty-seven public and privately-held companies participated in this survey from technology, consumer products/retail, manufacturing and insurance sectors. Two of the sales roles we looked at are Direct Sales professionals and Account Managers. Key findings from this survey include:
Overall, sales strategies are focused on increasing the number of customers/new logos and growing revenue. Companies are continually looking for ways to maintain or make their plans simple, aligned with the business needs and priorities, and effective in rewarding the desired behaviors and results. The most prevalent plan changes were to ‘improve alignment with strategy’ and ‘change performance measures’. In the survey, no company viewed the effectiveness of their sales compensation plan as “Excellent” or “Negative”. Fifty three percent rated their plans “Positive”, 27% “Neutral” and 13% “Problematic”. Seventy three percent felt their plans motivated their sales professionals either at a “great” or “moderate” level, 20% to “some extent” and 7% to a “little extent”.
In most cases, we confirmed the practice that the plan design is different between Direct Sales and Account Manager roles as follows:
- 21% to 25% of outside sales professionals are eligible for equity based awards while 57% of first level sales managers are eligible.
- 82% of Direct Sales roles and 67% of Account Managers are paid based on total gross sales or revenues. It is also prevalent for Direct Sales to be compensated based on revenue from new accounts, followed by revenue from existing accounts.
- 29% of participants use a combination of commission and bonus for Direct Sales while 33% for account managers. Commission only plans are most prevalent for Direct Sales (41%) and less prevalent for Account Managers (33%).
- 22% of Direct Sales roles have individual commission rates. Another 22% have commission rates based on new versus existing customers, 28% vary the commission rates by product and another 28% have one fixed rate. For Account Managers, 40% have one fixed rate, another 40% have individual commission rates and 20% have different rates based on products.
- Most companies (71%) do not provide an accelerator to their commission rates. When accelerators (i.e., an increase in the commission rate) are used, there tends to be 3 or more points of acceleration. The triggers are annual sales performance.
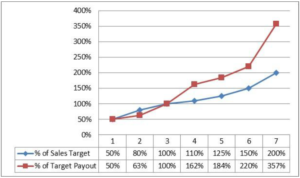
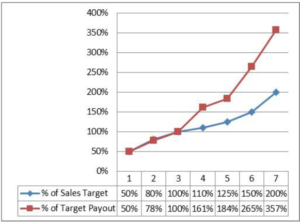
- The impact of accelerators is seen in the pay for performance relationship, with aggressive payouts for performance above target. For Account Managers, when they reach 80% of their sales target, they are paid 63% of their target payout, for 110% achievement, 162% payout, 150% achievement and 220% payout. For Direct Sales, there were similar relationships but notably Direct Sales had a better payout of 78% for 80% achievement and 265% payout for 150% achievement. We were surprised that both achieve 357% payout for 200% achievement. See figures 1 and 2.

Figure 1: Account Manager

Figure 2: Direct Sales
- Direct Sales roles have more pay at risk with 60% of total compensation in base salary and 40% in incentive. Account Managers have 70% in base salary and 30% in incentives.
Wilson Group’s 2017-2018 survey will be available for participation in late summer 2017 and we urge you to participate. Your participation guarantees a FREE survey report just in time for 2018 planning. Review our last complete report Wilson Group Sales Comp Practices Survey Report 2014-15
If you have any questions on this topic or would like to discuss your company’s sales compensation plans… contact Susan Malanowski at smalanowski@wilsongroup.com.


